
UK Digital Commerce — 2026 Market Snapshot
DATA VISUALISATION & INFOGRAPHICS
A self-initiated data visualisation concept transforming digital commerce data into a clear, accessible and engaging market snapshot.
Role: Graphic Designer / Information Designer
Tools: Figma
Description:
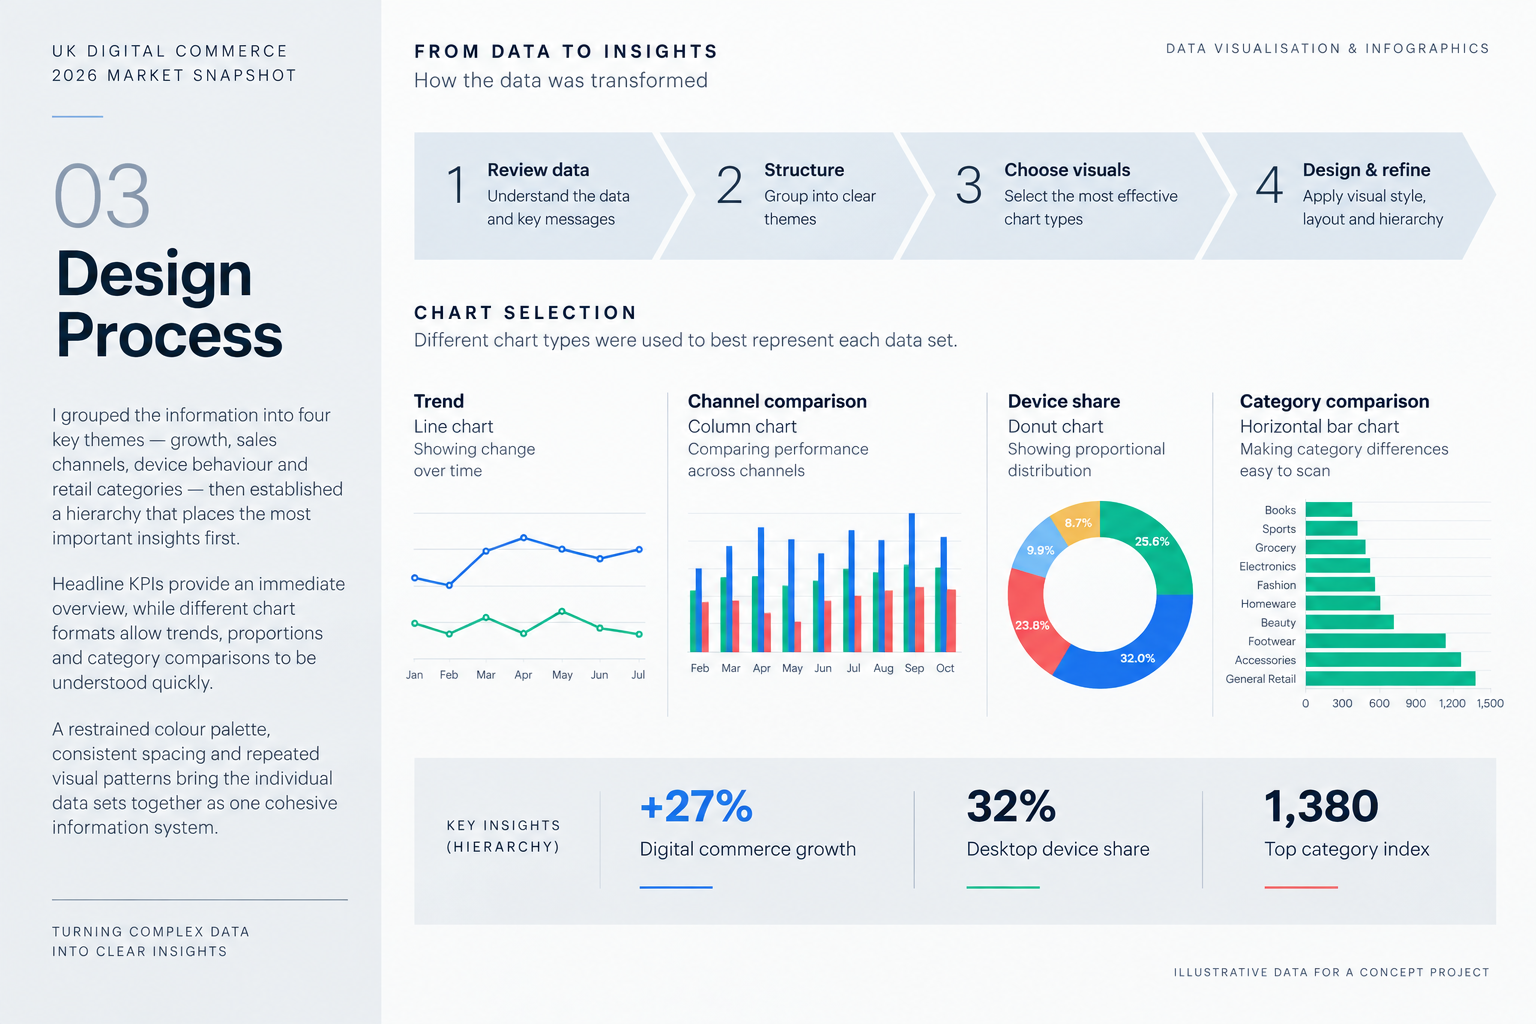
A self-initiated data visualisation concept exploring how digital commerce information can be organised into a clear, accessible and visually engaging market snapshot.
The dashboard brings together commerce growth, sales channels, device behaviour and retail category performance within a cohesive visual system, allowing multiple data sets to be quickly scanned, compared and understood.
The project focuses on information hierarchy, clarity and consistency, using varied chart formats, concise headline metrics and a restrained visual system to turn complex information into an intuitive visual story.
Deliverables: Data Visualisation • Dashboard Design • Information Design • Infographic
Let’s Work Together
Interested in working together or discussing a project? Feel free to get in touch.
© 2026 Dana Onyenakala. All rights reserved.